Happy 2020! In this blog post, I will take you through one of the problems that we tackled during my time as a data scientist with the online educational platform Isaac Physics. Here we used machine learning to predict the likelihood of user churn (i.e. whether a given user will continue using the platform or will stop using it altogether). With simple ML algorithms, we were able to do a lot, and much of the success boiled down to the clean and structured data repository of clickstream data that IP had.
Introduction
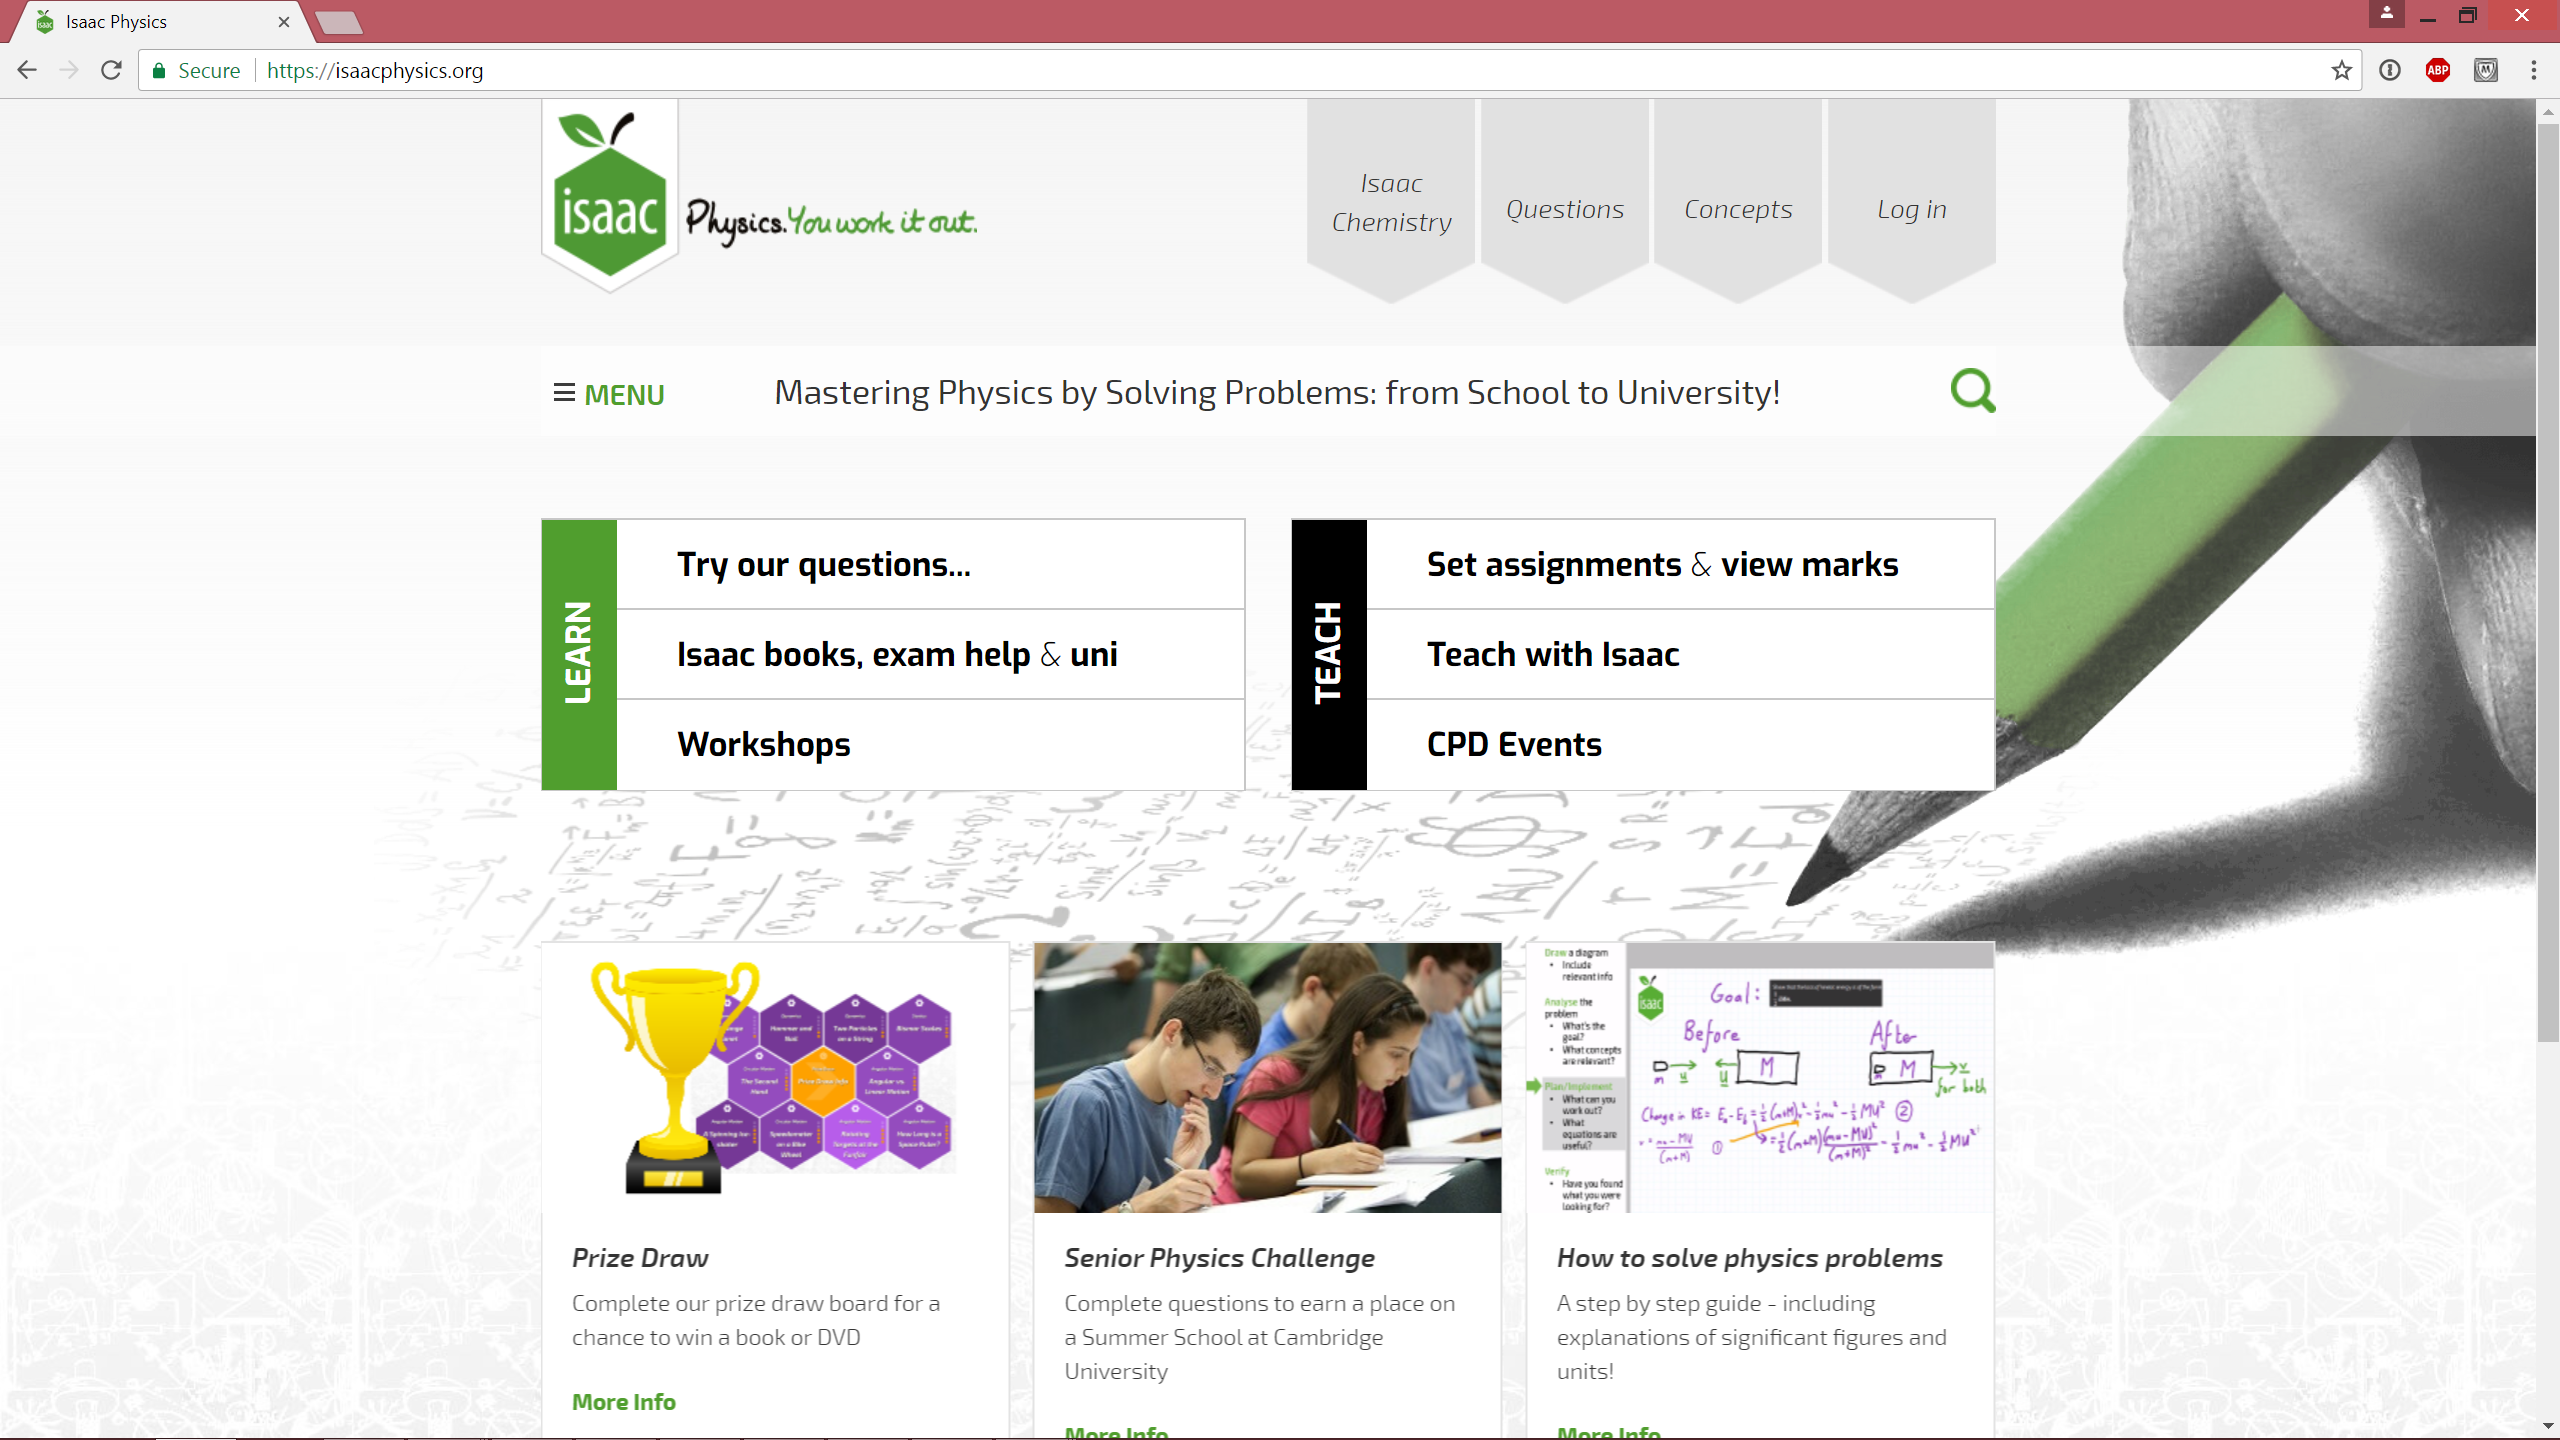
In a nutshell, Isaac Physics (IP) is an online educational platform that aims to improve STEM education throughout the UK by providing students with the free resources needed to consolidate their understanding of Physics and Mathematics. Check out their slick website at https://www.isaacphysics.org.
Data-driven Research: Problem of User Churn
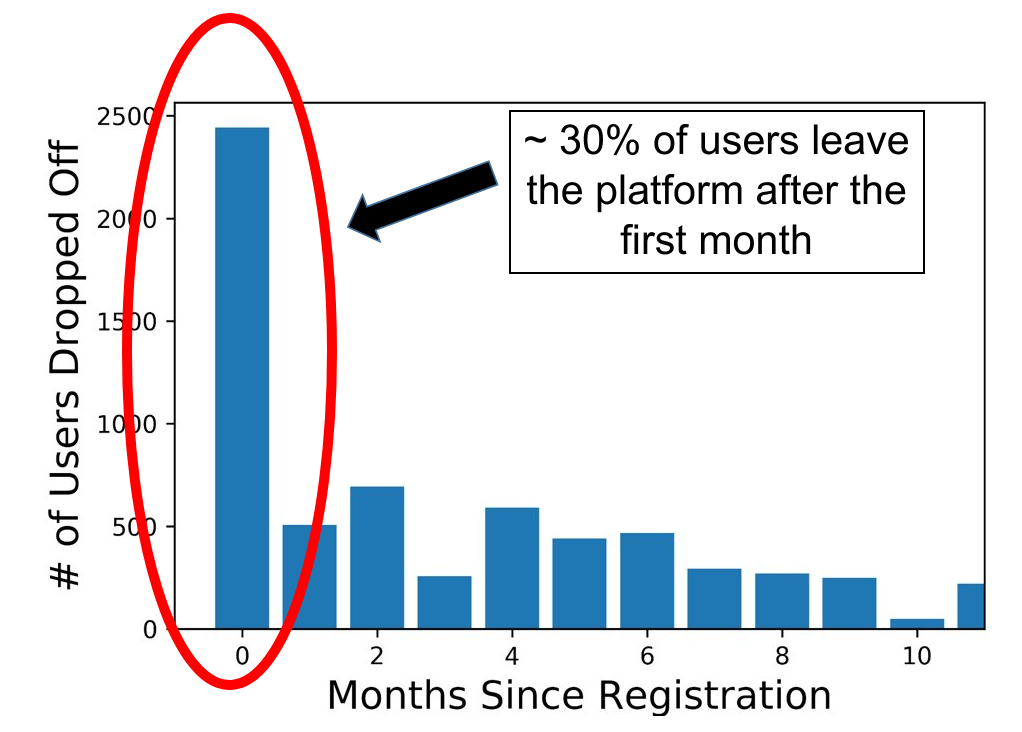
Over the last few years, IP has received over 60,000 registered users and recorded over 8 million question attempts. I was most impressed with the structured, effective and easy to read manner that the clickstream data was captured in (SQL for the win!). IP really have an excellent team of software developers and data engineers who made the data easy to query and explore. Another thing that made IP so great to work for, was their open-ended nature. We could define and attempt to solve any problem that we thought was worth tackling. The sky was the limit. Our first challenge? To tackle a problem that is endemic to many online platforms, the issue of user retention. More precisely, the nightmare of losing 30% of users following registration after only one month of activity.
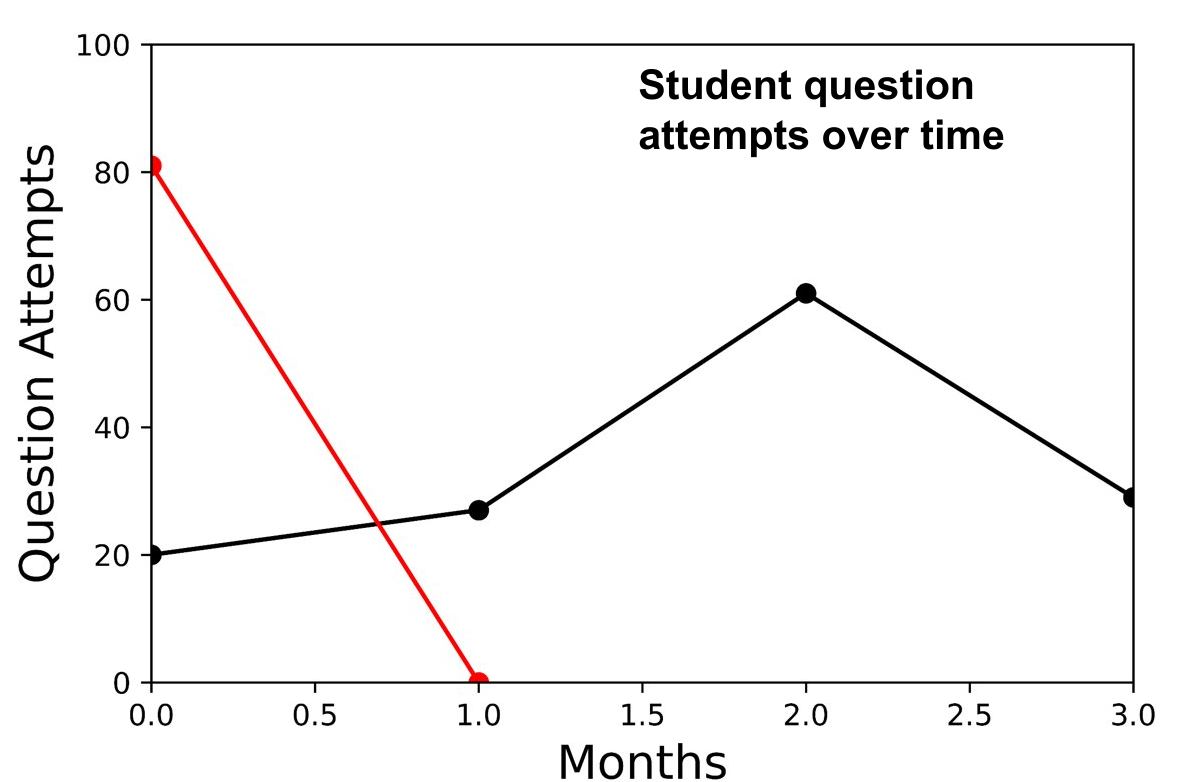
Now initially, I thought that with the clickstream data at hand, we would easily determine who were the users likely to stop using the platform. For instance, you would imagine that a user who attempts a lot of questions and engages with the website would naturally stay on the platform for longer. Conversely, a user who attempts only a few questions, seems to have a limited interest in using the website and hence will probably stop using it sooner rather than later. Ohh how naive I was! The image below shows the behaviour of 2 separate users after registration. The red line marks a user who did a lot of questions in the first month and then permanently left the platform. The black line on the other hand indicates a user who does only a few question attempts, but consistently uses the platform every month. How can we determine who will stay and who will leave? The secret in developing a successful churn predictor is to know your audience. In machine learning terms, it’s all about feature engineering (i.e. designing and selecting the best input features for your ML model). For us, that meant accounting for the behaviour and activity of teachers on the IP website.
Feature Engineering: The Importance of Teachers
An important feature of the platform is the ability of teachers to enroll their pupils and to set homework problems for them to complete. The teachers can track the progress of their pupils and identify if there are any problems in understanding the content matter. What does this mean for our churn model? This meant that we should not only engineer features related to the activity of the user, but also to the clickstream data of their teachers.
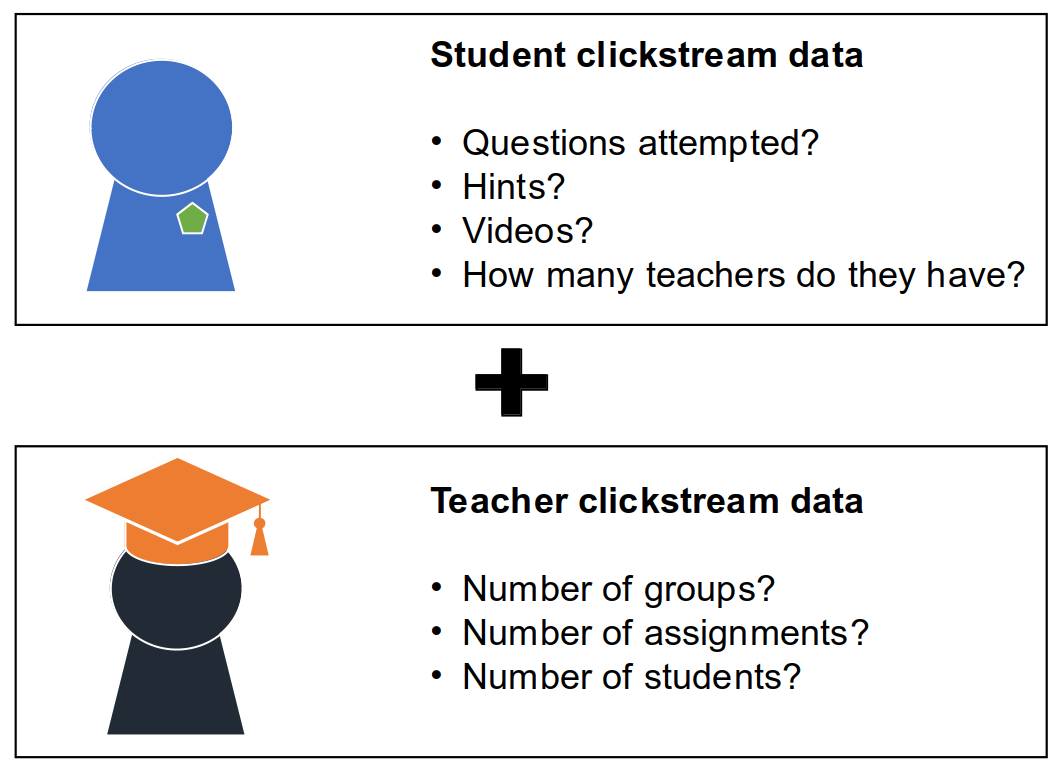
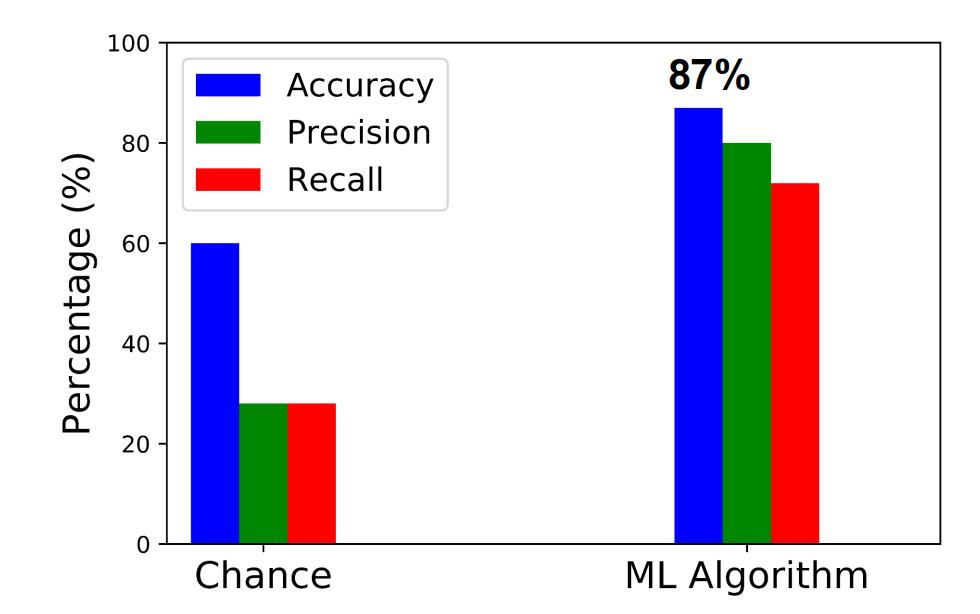
Using these newly identified features, we were capable of determining with an 87% accuracy whether a user would stay on the platform or leave using a good ol’ Random Forest Classifier. A strong advantage in using this algorithm lies in its ability to determine the strength of each feature in calculating user churn. It was clear that the key features involved in identifying user churn were those affiliated with the teacher rather than the user. This means that the teachers are the stars of the show and are instrumental in ensuring that students keep on using the IP platform.
Feeding Insight into Action
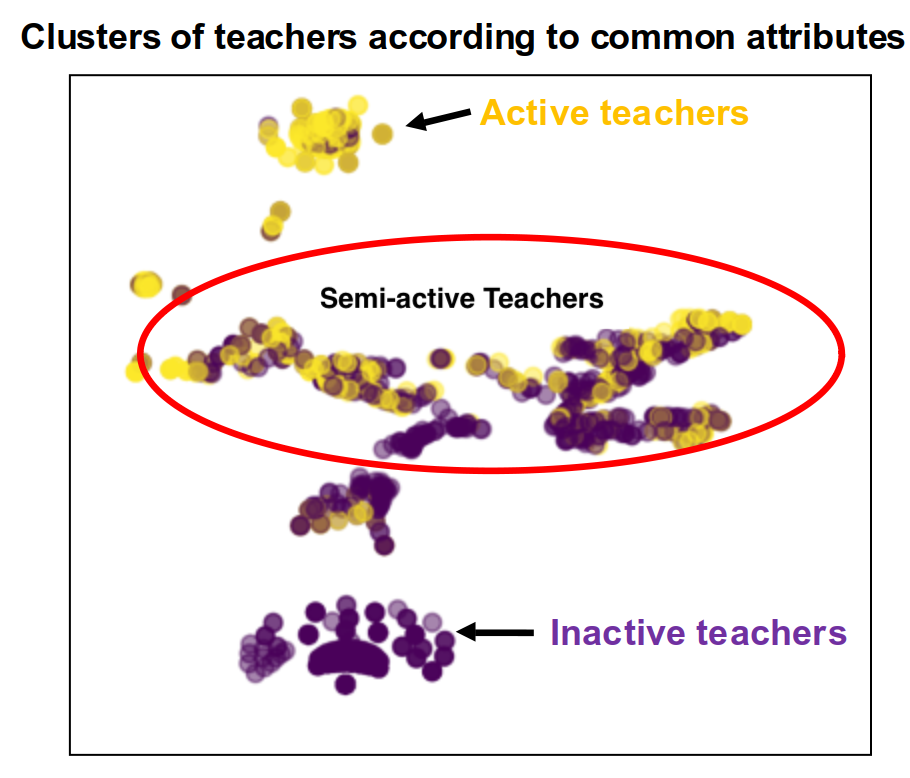
So we built a user churn model and identified the dominant factors that drive its behaviour. What next? The key outcome of any data science project is to feed insight into action. From the model, it is clear that by ensuring the co-operation of the teachers, we can encourage the pupils to actively continue using the platform. So how do we identify which teachers are likely to stop using the platform (and hence indirectly influence their students to stop using it as well)? Using the features that we engineered to represent teacher activity on the platform, we can use an unsupervised ML algorithm to group them into 3 distinct groups (those that actively use the website, those that were never likely to use it and those somewhere in the middle). This group in the middle corresponds to both active and inactive teachers, the latter of which can be invited to attend workshops organised by IP to help them better understand how they can leverage the platform in their teaching. In this way, we can hope to actively encourage some of the inactive teachers to use the platform and thereby encourage their pupils to use it as well.
Lessons Learned
My time in IP was a great experience in applying machine learning and data science to solve important, real-world problems. In this case, we were helping to drive education and interest in STEM subjects nationwide to offer new opportunities to more and more young adults. Here are a few takeaways from this project:
- Know your audience! The importance of domain knowledge cannot be overstated, and some of the success of this project boiled down to effective feature engineering.
- SQL is king. Having a structured and easy to query data repository makes it that much easier for data exploration and obtaining an intimate knowledge of your dataset. Hats off to the incredible team at Isaac Physics for making this happen.
- Open-ended problem solving is challenging but super rewarding. Not having a definite problem to solve a la Kaggle style can seem intimidating at first, but it reaps rewards in growing as a data scientist.