In the last few months, I realized that a lot of my time was occupied with anomaly detection of process data. More specifically, given a set of temperature, pressure and flowrate readings, can we detect if the chemical process in question is deviating from normal behaviour, and if yes, can we find what caused it? As a data scientist, this is an incredibly satisfying task to undertake, almost akin to finding Wally in the series of ‘Where’s Wally’ puzzle books.

However, I had a relatively shallow knowledge as to how this was typically applied to chemical engineering systems. To my pleasant surprise, there is a rich and vast literature of applying statistical and other mathematical techniques to determining the presence of anomalies in process data. For anyone who wants a strong primer in this field, I would recommend Marget Bauer’s excellent thesis on ‘Data-Driven Methods for Anomaly Detection’ (https://discovery.ucl.ac.uk/id/eprint/1446237/1/U593572.pdf).
What I find particularly exciting about this field is that machine learning and data science has really matured in the last 10 years. How these new techniques can help operators track the health of their chemical process is an open question that more and more people outside of academia are starting to tackle. In the world of subsea oil and gas systems, we are particularly interested in tracking the integrity of our process equipment, in particular ensuring that we catch all petrochemical, gas and water leaks as soon and as accurately as possible.
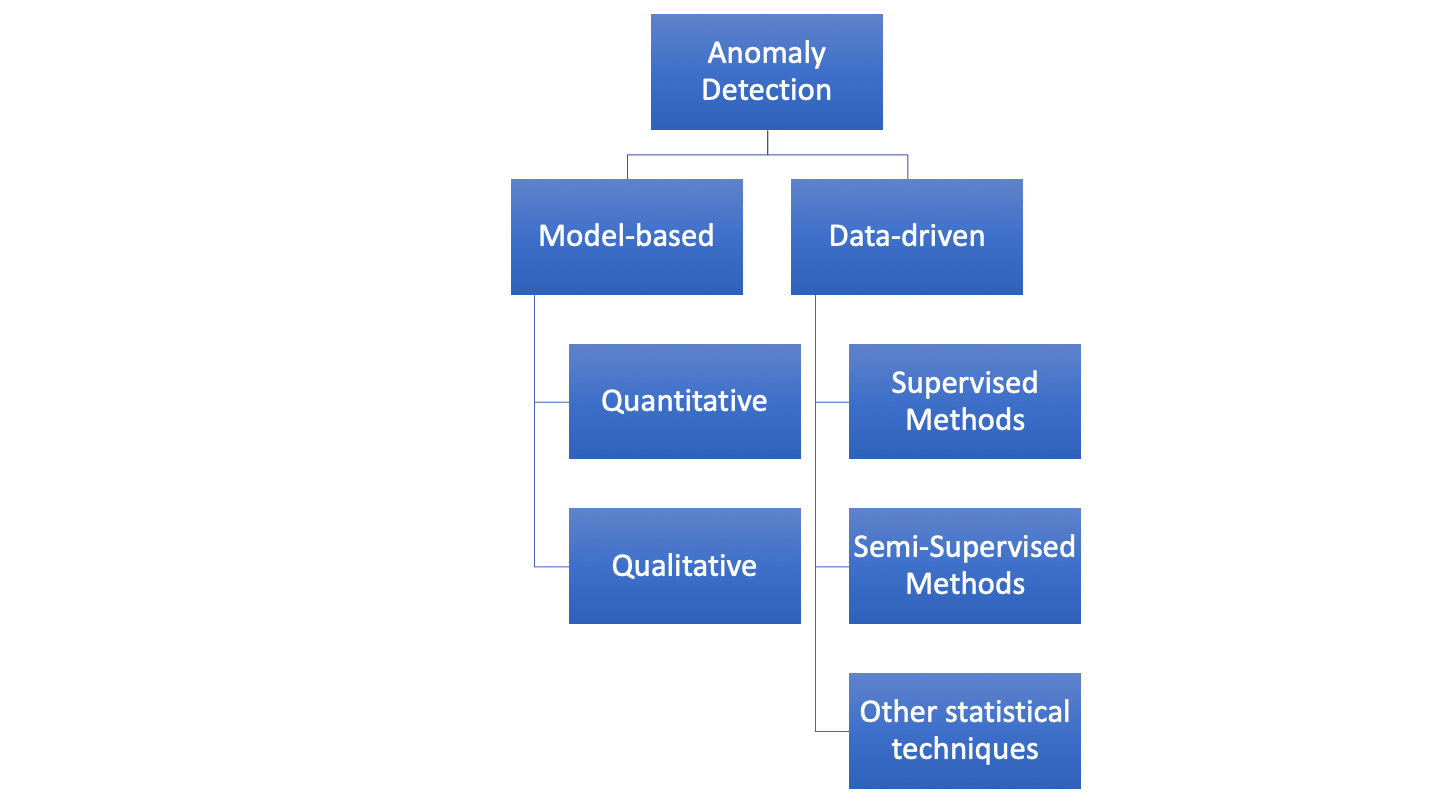
More importantly, anomaly detection problems can sometimes be addressed with the use of both engineering and data-driven approaches. How these 2 approaches can be married together to deliver an anomaly detection tool that is both competitive and interpretable to the end user needs to be addressed (i.e. we want to know when an anomaly occurs and what caused it)? Anomaly detection in chemical engineering can be broadly classified into the following approach (as mostly stipulated by Bauer, but I also agree :D).

If we know the engineering system in question, we could provide a model-based approach whereby we specify some kind of functional relationship that we expect to hold (e.g. if pressure drop across a pipeline goes up, so should the flowrate). Any behaviour that deviates from this relationship we classify as an anomaly. However, if the system is too difficult or time-consuming to model, we can use a data-driven method whereby we use a statistical technique to identify anomalous behaviour. In the latter instance we use typical data-science techniques to achieve our goals. Over the next few blog posts, I hope to delve into this field a little more, and offer some of my own insights into what works and what doesn’t.
See you until then!